As part of a hackathon last week I had the pleasure of playing with some technologies that I didn’t have an enormous amount of exposure to. The focus of my team’s part of the hackathon was the following:
- Analysing a video with Cognitive Services
- Processing the results from Cognitive Services
- Saving the results to a data store so it can be displayed
- Visualizing the results with Power BI Embedded
My personal work and this resulting post deals mainly with the second and third items as there were some unique challenges that came into play when utilising the output that came from streaming analytics. The flow of data looked a little something like this:

We hacked on Azure Media Services being analysed by Azure Cognitive Services and posted its results to Event Hub. We then used Stream Analytics to process and group the data before throwing the results into a Service Bus queue. We grabbed the data with a simple Logic App, inserted it into a SQL Azure table and rounded out the flow with a visualisation in Power BI Embedded. I know that’s a lot of ingredients to throw in an omelette but let’s go break a few eggs…
First, the results from the Cognitive API services were sent to Event Hub. This was processed with a streaming analytics job that looked like this:

Cognitive Services was used analyse the stream and the emotion APIs detected the happiness of the subjects in the video. We wanted to group the happiness into a rolling type window every two minutes and streaming analytics provides us with the ability to do that. Streaming analytics allows several types of temporal operations that can be performed on streaming data. These are Tumbling, Hopping and Sliding windows and I’ll explain how each works and why we chose to use the sliding window.
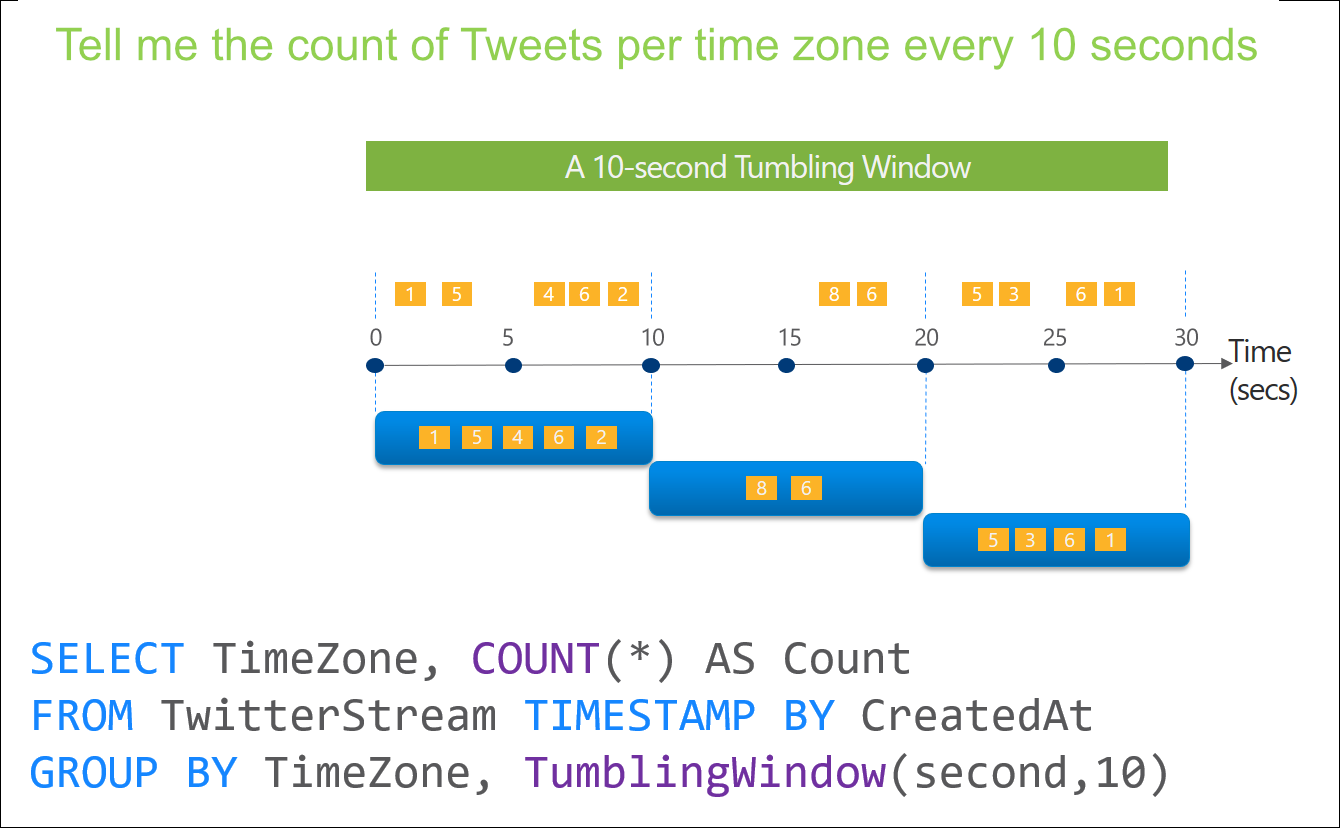
Tumbling Windows
Tumbling window functions are used to segment a data stream into distinct time segments and perform a function against them, such as the example below. The key differentiators of a Tumbling window are that they repeat, do not overlap and an event cannot belong to more than one tumbling window.
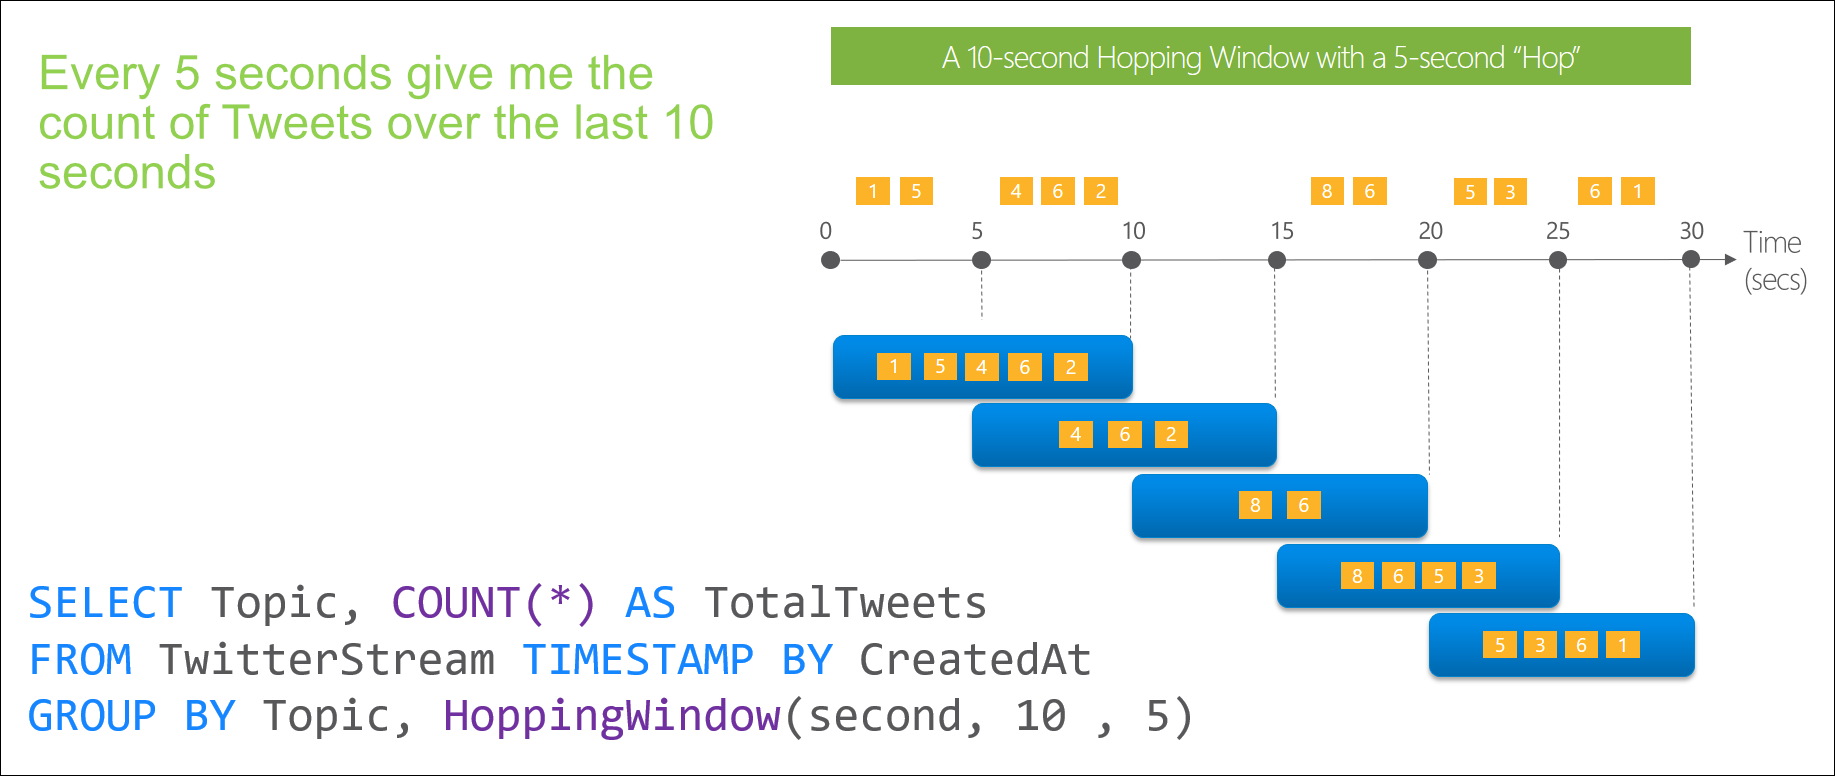
Hopping Windows
Hopping window functions hop forward in time by a fixed period. It may be easy to think of them as Tumbling windows that can overlap, so events can belong to more than one Hopping window result set. To make a Hopping window the same as a Tumbling window one would simply specify the hop size to be the same as the window size.
Sliding Windows
Sliding window functions, unlike Tumbling or Hopping windows, produce an output only when an event occurs. Every window will have at least one event and the window continuously moves forward by an € (epsilon). Like Hopping Windows, events can belong to more than one Sliding Window.
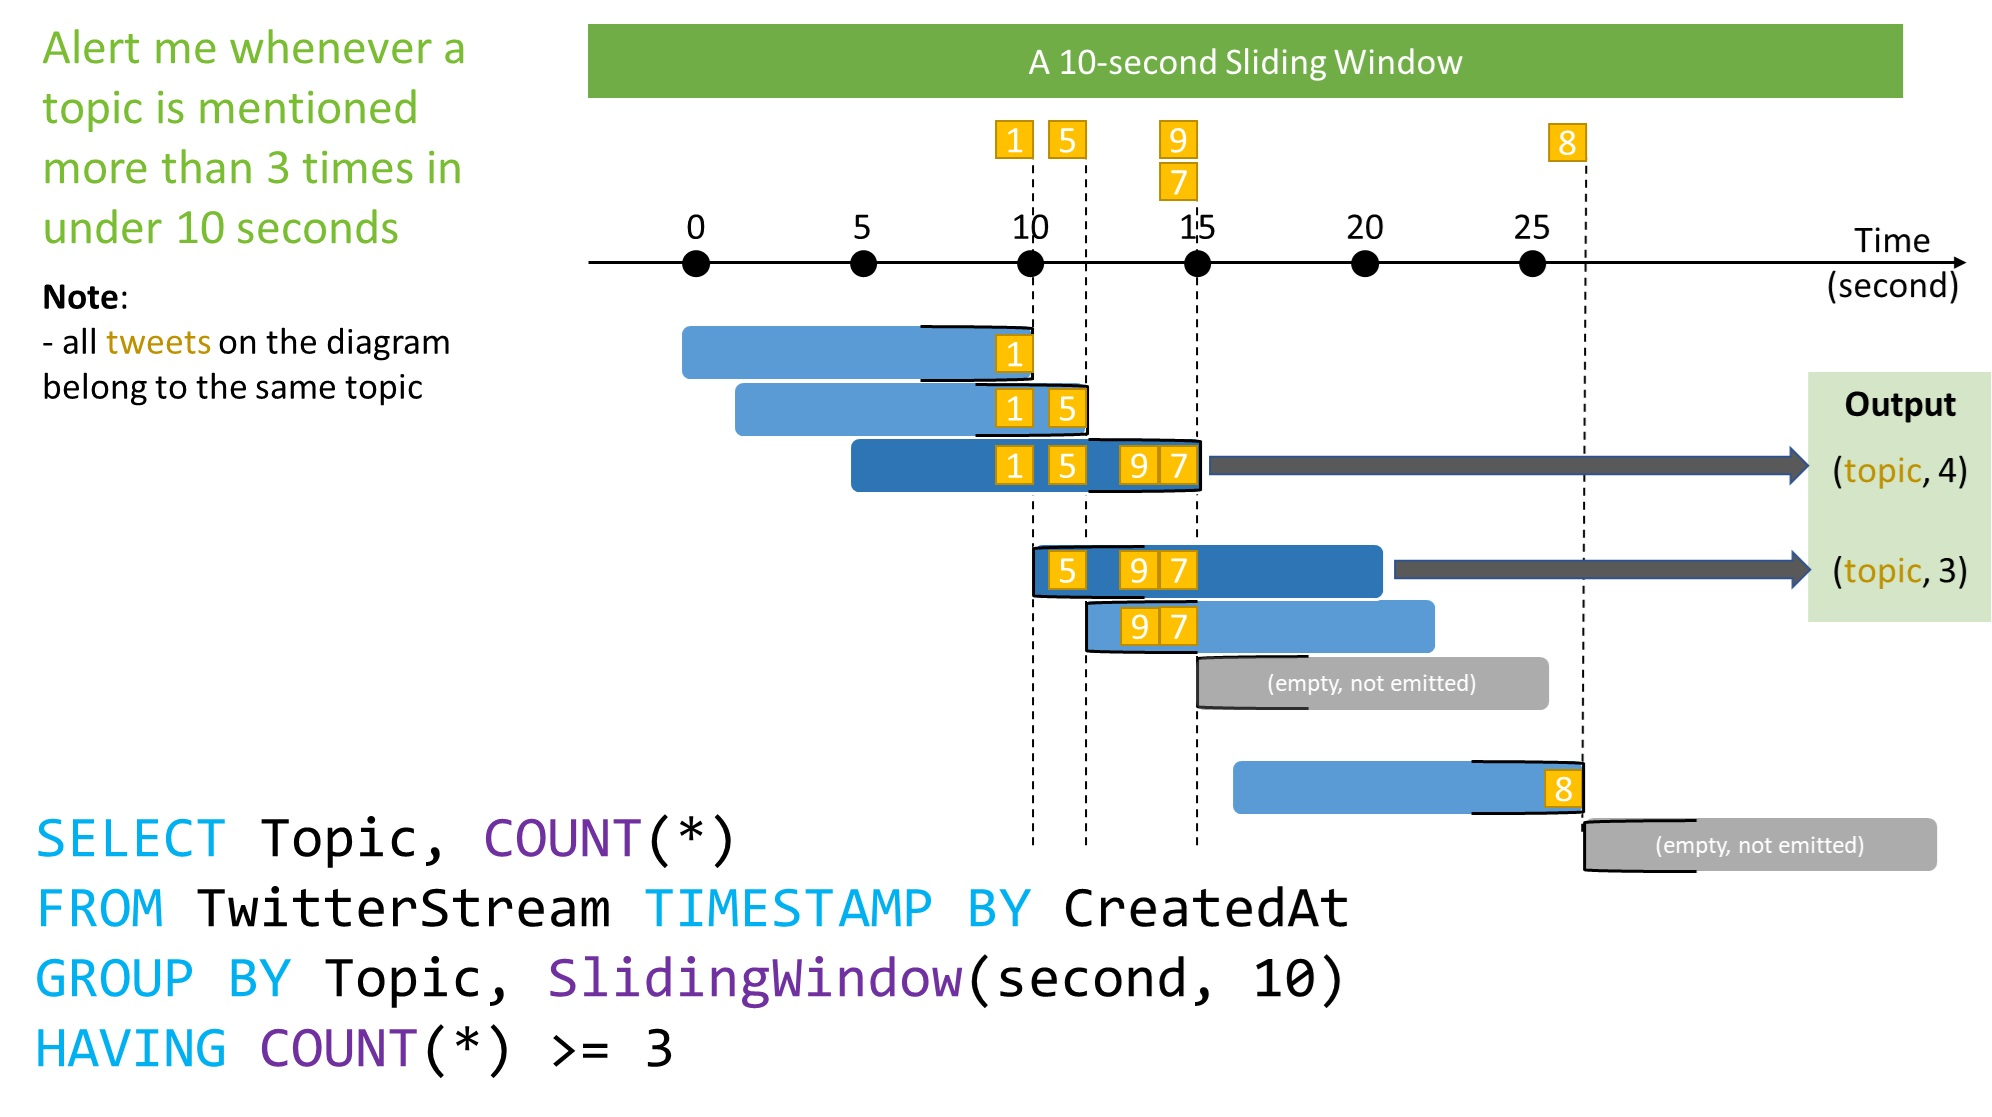
Since we wanted a rolling window only when data exists we chose to use sliding windows and the resulting query looked like this:

The output was pushed onto a Service Bus queue and this is where things got a little interesting.
To process the resulting data on the Service Bus queue we implemented a Logic App to take the JSON, parse it and insert the results into an Azure SQL table. The Logic App was simple and these were the basic steps involved:

After configuring the step to pick up any items from the Service Bus queue we found that the resulting data had been serialised strangely and contained extra meta data that prevented JSONConvert from being able to parse it:
This file contains bidirectional Unicode text that may be interpreted or compiled differently than what appears below. To review, open the file in an editor that reveals hidden Unicode characters.
Learn more about bidirectional Unicode characters
| { | |
| "Content": "@\u0006string\b3http://schemas.microsoft.com/2003/10/Serialization/�\u001b{\"avg\":0.43784444635294145}" | |
| } |
Luckily I found this great TechNet article with some details on how to clean up the incoming data so I could insert it in database. With the help of this article I created the Azure Function below to clean up the message content so we could use it effectively in the subsequent steps.
This file contains bidirectional Unicode text that may be interpreted or compiled differently than what appears below. To review, open the file in an editor that reveals hidden Unicode characters.
Learn more about bidirectional Unicode characters
| #r "Newtonsoft.Json" | |
| using System; | |
| using System.Net; | |
| using Newtonsoft.Json; | |
| public static async Task<object> Run(HttpRequestMessage req, TraceWriter log) | |
| { | |
| // Grab the JSON that stream analytics has thrown on the queue | |
| // It will look something like the example below and we need to clean | |
| // it up so we can load the JSON payload inside it. | |
| //{ | |
| // "ContentBag": "@\u0006string\b3http://schemas.microsoft.com/2003/10/Serialization/�\u001b{\"avg\":0.48083300419999553}" | |
| //} | |
| log.Verbose($"Webhook was triggered!"); | |
| string jsonContent = await req.Content.ReadAsStringAsync(); | |
| log.Verbose($"json content: {jsonContent}"); | |
| dynamic data = JsonConvert.DeserializeObject(jsonContent); | |
| string msgBody = data.ContentBag; | |
| log.Verbose($"Message Received: {msgBody}"); | |
| int length = msgBody.Length; | |
| log.Verbose($"Message Length: {length.ToString()}"); | |
| // Grab the payload inside the ContentBag value between the curly braces and dump | |
| // the other rubbish. | |
| int start = msgBody.IndexOf("{"); | |
| int end = msgBody.LastIndexOf("}"); | |
| string result = msgBody.Substring(start, end – start + 1); | |
| log.Verbose($"Result: {result}"); | |
| // Deserialize the value inside and pass it back for processing in the logic app | |
| return req.CreateResponse(HttpStatusCode.OK, JsonConvert.DeserializeObject(result)); | |
| } |
https://gist.github.com/slamb2k/98627d5e4d876927877bbf4536513c03.js
Note the #r “Newtonsoft.Json” line which includes the reference to the library which contains JsonConvert. The #r is how you add reference to an Azure Function so we can deserialise and work with the payload from the Service Bus. After I created this Azure Function I could add it to Logic App and clean up the data inline. The Logic App then looked like this:

Note that we had to wrap the content in another JSON element as the Azure Function expects valid JSON to be passed to it.
We could then finally insert the data into the table in our Azure SQL database.

Unfortunately, the AVG value from our stream analytics output isn’t available in the designer so we have to go to the code view and update the HappinessScore by adding the “@{body(‘CleanGarbage’).avg}“ function explicitally. It will then reflect in the designer view:
This file contains bidirectional Unicode text that may be interpreted or compiled differently than what appears below. To review, open the file in an editor that reveals hidden Unicode characters.
Learn more about bidirectional Unicode characters
| "Insert_row": { | |
| "inputs": { | |
| "body": { | |
| "HappinessScore": "@{body('CleanGarbage').avg}" | |
| }, | |
| "host": { | |
| "api": { | |
| "runtimeUrl": "https://logic-apis-australiaeast.azure-apim.net/apim/sql" | |
| }, | |
| "connection": { | |
| "name": "@parameters('$connections')['sql']['connectionId']" | |
| } | |
| }, | |
| "method": "post", | |
| "path": "/datasets/default/tables/@{encodeURIComponent(encodeURIComponent('[dbo].[Happiness]'))}/items" | |
| }, | |
| "runAfter": { | |
| "CleanGarbage": [ | |
| "Succeeded" | |
| ] | |
| }, | |
| "type": "ApiConnection" | |
| } |
With the data in the database we could then spin up our Power BI Embedded dashboard and view the Happiness trend over time.

While the scenario being discussed here was specific I hope that helps some other people out there when they want to process the same kind of information as I did. If I make just a few other people’s life easier it would have been worth it…
