I love a good feedback loop…
Gene Kim talks about the importance of both internal and external feedback loops in his blog post, The Three Ways: The Principles Underpinning DevOps. This includes internal feedback loops such as the result of continuous integration builds, unit testing and application performance monitoring tools like Application Insights. It also incorporates feedback loops from end-users to leverage telemetry and error information to increase the quality of the delivery. This telemetry is the foundation required to prove the outcome of experiments and hypothesis driven development.
In a recent presentation at Xamarin Dev Days 2017 in Melbourne I demonstrated the ease in which teams could adopt DevOps in their mobile application development lifecycles. To do this I embraced our new platform, Visual Studio Mobile Center and showed how teams could leverage it’s API to implement the feedback loops required for hypothesis driven development.
With Mobile Center in place to provide continuous integration and continuous delivery we can maximise our potential to learn quickly from the people actually using our products. To do this we need to monitor our users actions and ensure that the metrics that are important to us are visible to the entire team. This is the basis of hypothesis driven development and our intention to learn from our users rather than dictate how our products behave.
In hypothesis driven development we define our story as an experiment with the action you need to implement and a result showing whether the strategy is worth pursuing:
We believe… <this capability>
Will result in… <this outcome>
We will know we have succeeded when… <we see a measurable signal>
In the Xamarin Dev Days presentation I had an Xamarin.Forms application that demonstrated a few different sample hypothesis that we were evaluating. An example of one of these experiments written as a hypothesis story is:
We Believe That suggesting associated items on the checkout page
Will Result In additional sales of our stock
We Will Know We Have Succeeded When we see a 5% increase in sales that is directly attributed to the user clicking on these suggested items
In order for the team to easily see the results of this and other related experiments we need to make them immediately visible on a team dashboard. As the team in my example is using Visual Studio Team Services for their application life-cycle management the dashboard could look like this:
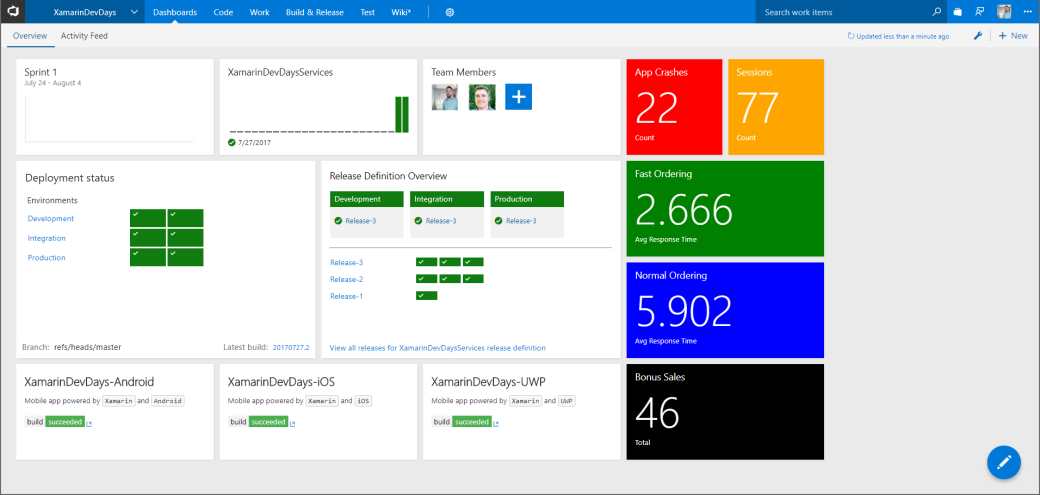
Note the dashboard shows a number of different feedback loops that are relevant to the team as a whole:
- The CI build for the back-end REST API
- The release pipeline for the back-end REST API
- The CI builds for the different flavours of the Xamarin application. As no Mobile Center specific widgets are currently available for VSTS I showed how to do this in a previous blog post.
- Telemetry and crash analytics extracted from the Mobile Center REST API.
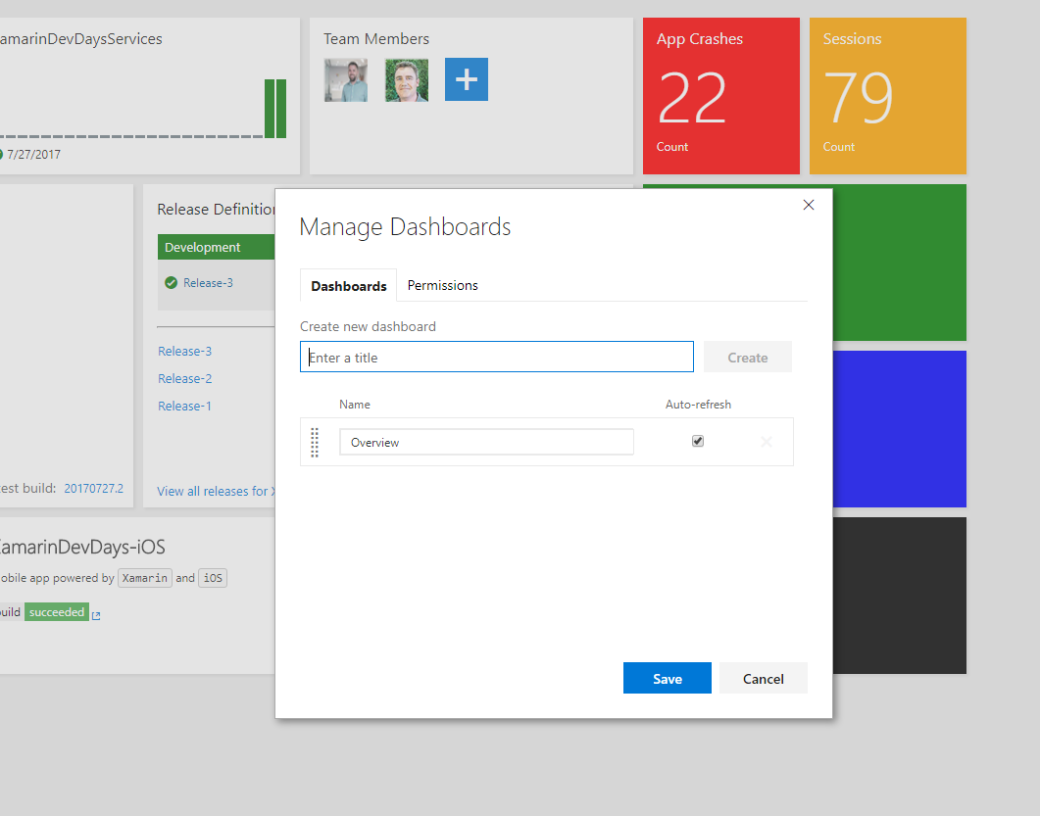
There are widgets for Application Insights that can be harnessed on your VSTS based dashboard. At present Mobile Center doesn’t integrate with Application Insights like Hockey App did but you can vote for that feature on the feedback page. In the meantime we can directly integrate to Mobile Center’s REST API to extract the rich telemetry information and display it via an iframe widget. Microsoft already provides one of these and it can be added from the extension gallery:


The size can be configured and the url of the website that presents that information should be entered here. Wait a second, this magic website to present the telemetry doesn’t exist, does it? No, but it’s easy to build…
The Mobile Center REST API documentation provides a straightforward way to navigate your way through the options available to third parties wishing to integrate. I found the REST method for getting counts on the different event properties I was recording:

For my dashboard, I wanted to show the following telemetry recorded in my application:
App Crashes – The total amount of crashes recorded by the application since a specific date.
Sessions – The total amount of user sessions recorded by the application since a specific date.
Fast Ordering – The average time it was taking to use a new ordering workflow in the application.
Normal Ordering – The average time it was taking to use the existing ordering workflow for bench-marking purposes.
Bonus Sales – The total number of additional items ordered when using a new ordering flow that suggested items the customer may also wish to purchase.
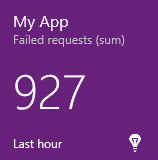
With the knowledge of what REST method to hit and what information I wanted to show I threw together a collection of web pages to show a number of simple widgets. You can check them out on Github. Basically, I just generated an API key and hit the API to calculate the results for the telemetry I required. Here’s an example of one of the widgets and it’s simple underlying calculation:
This file contains bidirectional Unicode text that may be interpreted or compiled differently than what appears below. To review, open the file in an editor that reveals hidden Unicode characters.
Learn more about bidirectional Unicode characters
| function GetData() { | |
| var xhttp = new XMLHttpRequest(); | |
| xhttp.open("GET", "https://api.mobile.azure.com/v0.1/apps/silamb/XamarinDevDays/analytics/events/NormalOrdering/properties/TimeTaken/counts?start=2017-07-24&count=10", false); | |
| xhttp.setRequestHeader("Content-type", "application/json"); | |
| xhttp.setRequestHeader("X-API-Token", "a0a1a9dd0747e90d365a925ea3de9523d2beaf01"); | |
| xhttp.send(); | |
| var response = JSON.parse(xhttp.responseText); | |
| total = 0; | |
| for (i = 0; i < response.values.length; i++) { //loop through the array | |
| total += +response.values[i].name / response.values.length; //Do the math! | |
| } | |
| document.getElementById('tileValue').innerHTML = total.toFixed(3); | |
| } |
With the web pages in hand for the widgets I required, I then needed to host these somewhere. I created an App Service on Azure and used the Deployment Options blade to configure a simple CI/CD pipeline from Github:

Any commits from here on in would be pushed directly to the website. I was then able to configure my embedded webpage widgets with the widgets I had created and show the desired telemetry to the team.
With this in place I could activate the auto-refresh option and the team could collectively see the results of their experiments along with the all the other feedback loops that are crucial to continual improvement of any high functioning team.
I recognise that the creation of these widgets is a pretty custom exercise. I considered writing VSTS extension widgets for the dashboard but when Application Insights integration arrives I will be able to leverage what currently exists in the marketplace:
Until then this was a nice little demonstration of Mobile Center’s API-first architecture and what can be achieved when we take some solid tools like Mobile Center plus Azure and #RubDevOpsOnIt.
